FreezeFrame
A video-based, 4-channel system for Fear Conditioning, Tail Suspension and Porsolt Swim Test that rivals the human observer in sensitivity.
FreezeFrame 5:#
Video System for Fear Conditioning – Tail Suspension – Porsolt Swim Test
- FreezeFrame now supports fear conditioning in optogenetic experiments
- FreezeFrame now ships together with LimeLight at no extra cost. LimeLight is our general-purpose tracking program for Open Field, Plus Maze, Radial Arm Maze and Novel Object Recognition and WaterMaze. Together FreezeFrame and LightLight provide automated video tracking for a complete range of rodent behavioral experiments.
- Complete systems available, including software, cameras, control interface, cages, isolation cubicles, shockers, audio amplifiers and cue and house lights.
FreezeFrame, the first video-based system for fear conditioning, has become the standard in its field. It combines the sensitivity of the human observer with the objectivity and high throughput of automation. While infrared beams can detect gross movements of an animal from one part of the cage to another, FreezeFrame can detect the minute movements of grooming, sniffing, turning and rearing. And FreezeFrame monitors the animal at up to 15 times per second, not once every 5 seconds, for far more objective and reproducible results. FreezeFrame can also collect and process data for learned helplessness experiments, including Tail Suspension and the Porsolt Forced Swim Test.
Not a tracking system
 . A proprietary motion detection algorithm filters out shadows, light flicker and camera noise, and detects movements as small as 1 mm.
Superior low-light performance.
Fully validated. Greater than 90% concordance between FreezeFrame and trained human observers.
Multiple stimulus protocols can be stored and called up instantly for training and testing phases of the experiments.
New: FreezeFrame now supports pulsing stimuli at frequencies of up to 500 pulses per second and pulse durations as short as 1 ms.
New: FreezeFrame can now generate frequency-sweep sound stimuli. Start and stop frequency, and duration are all user selectable.
Up to 8 individually controlled outputs. For each output, a +5V signal is available for controlling TTL-compatible devices and a +24V (400 mA) output can be used for controlling lights and other high-current devices.
Store video images for later review. Export QuickTime and AVI movies for presentation.
Batch export data and analyses directly to an open Excel spreadsheet. Analyze % freezing, number of bouts, bout duration and intervals for specified periods.
Sounds (white noise or pure tone) are delivered through the computer’s sound card. Multiple sounds of different amplitude, frequency and quality (tone/noise or continuous/pulsing) can be delivered at different times during single trial. The shocker-scrambler is controlled directly from the computer, along with additional stimuli such as lights or external sound generators.
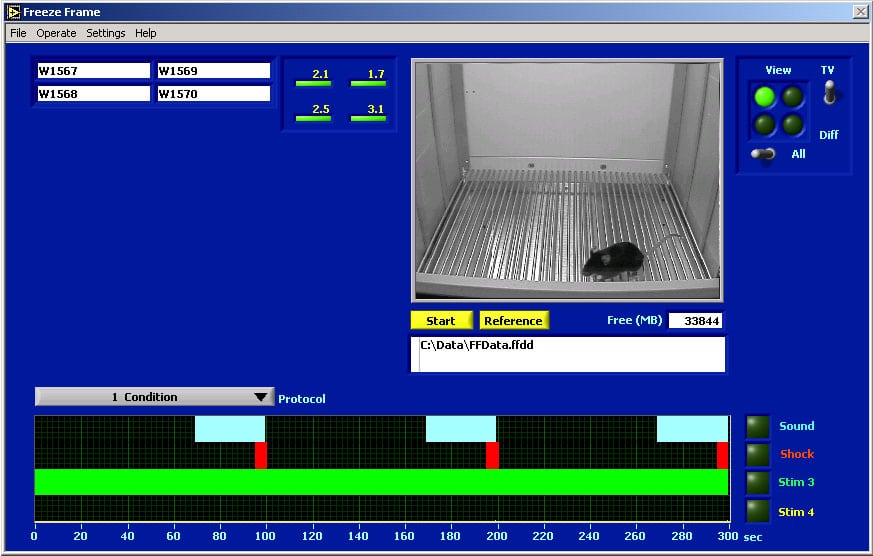
FreezeFrame Display Window#
The figure shows a snapshot of the FreezeFrame screen taken during a training session. Only 1 animal of the 4 being recorded is displayed here. Animals can be viewed all 4 at once, or one at a time as is shown here.
The selected protocol is shown in the display at the bottom of the window. The sound stimulus (a 5000 Hz tone) comes on for 30 seconds at 70, 170 and 270 seconds. The shock comes on for 5 seconds at the end of each sound stimulus. A light stimulus (#3) is on during the entire trial. The stimuli are specified in the Protocol Setup Window. The session lasts for 5 minutes.
The current protocol is number 1 out of the 20 that can be saved.
The current motion indexes for all 4 animals being recorded are shown to the left of the image. A value below 20 indicates freezing.
FreezeFrame for Optogenetics#
Screening out motion of the fiber optic cable
FreezeFrame has become the standard for automated scoring of fear conditioning experiments. Optogenetics, however, has added a new level of complexity to video-based scoring systems for fear conditioning: The fiber optic used for delivering light stimuli can vibrate and sway, even when the animal is perfectly still. The camera is sensitive enough to detect this motion, which can then artificially reduce the measured freezing time of the animal. FreezeFrame 5 has a new freezing detection algorithm that screens out the motion of the cable and reports motions of only the animal.

This new algorithm has been tested against human scoring in a lab with considerable experience in both fear conditioning and optogenetics. For the graph below, hand scores were performed independently, before the trials were analyzed in FreezeFrame, and the FreezeFrame scores were performed without reference to the human scores.
Pulsing stimuli
For some protocols, it is useful to pulse the light source in order to best activate cells optogenetically. The new digital interface will generate pulsing stimuli with frequencies of up to 500 Hz, and pulses as short as 1 ms duration. All of the stimulus parameters frequency, duration, pulse width, and on and off times during the trial, can be easily specified in the FreezeFrame program.
Screening out the stimulus light
For pulsing stimuli, light can sometimes leak from the cable and head fixture. To prevent pulsing stimulus light from creating motion artifacts, the chamber can be illuminated with far-red or infrared light. An infrared filter is then placed on the camera. Stimulus light is then filtered out and freezing is calculated from the infrared image. No change in camera is needed.
Optimal frame rates for Fear Conditioning#
FreezeFrame can collect images at up to 15 frames per second. From extensive experimentation, we have found that the optimal time between frames for measuring motion is 250-300 ms.
Shorter times cause a loss of sensitivity. That is, the shorter the time between measurements, the less the animal will have moved between one frame and the next, and subtle or slow movements made by the animal can be missed. At higher frames, then, FreezeFrame compares every 2nd or every 4th frame to keep the motion integration times at the optimum of 250-300 ms. Higher frame rates allow more frequent measurements of freezing, and higher temporal resolution of stored videos, at a cost of requiring more disk space to store.
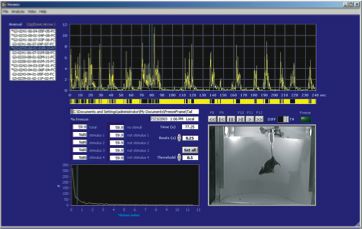
The Tail Suspension Trial Viewer#
The different animals stored in the data file can be selected from the listbox to the left. The video of the trial is played using the yellow player buttons. QuickTime movies can be exported from the trial video images.The top graph shows the time-course of the motion index calculated from the video frames. Values below 1 (see histogram at lower left) indicate freezing (inactivity). The yellow bar graph shows when inactivity occurred. Various data and video export functions are accessed from the menus.
Detecting motion in video images#
Detecting motion in video images FreezeFrame does not track the animal. A tracking algorithm finds the location of the animal’s center, whereas for fear conditioning we want to detect minute motions of the limbs and head that can occur while the animal sits in the same location. For that, a more sensitive global motion-detection algorithm is required.
Detecting the occurrence of motion from a video stream is in principle very simple. Compare successive images: If they are different, motion has occurred; if they are the same, there is freezing.
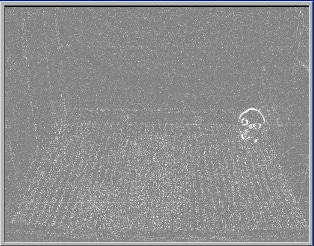
Difference image (with motion).
In a computer-based system, however, the images must first be digitized. A number is assigned to each pixel proportional to its brightness. Then two successive images are subtracted from each other, pixel by pixel. If the animal has not moved, the images will be identical and the subtracted values for each pixel should be 0. If the animal has moved, the values in the area where motion has occurred will be nonzero.
In practice, there are several problems. First, there is invariably noise or “snow” in the digital conversion process. The same brightness can get encoded as 143 one time and 145 the next. Second, the light level in the room tends to change imperceptibly as the power-line voltage, and therefore the lights, vary up and down a little each second. Third, the automatic gain control in the camera and the auto-iris opening can vary a little from moment to moment as they “hunt” for the correct level. These processes all generate differences between successive digitized images that are unrelated to motion.
One way used to differentiate real motion from artifactual image differences is through a simple threshold: Throw away all the pixel differences below a certain value. But this method can mistakenly exclude smaller movements of the animal and at the same time be fooled by high amplitude noise or camera gain changes. FreezeFrame uses a statistical approach, examining the entire distribution of pixel differences. The distributions generated by real motion and by noise or gain changes are very different in character and so are easily distinguishable using statistical methods. The result is a nearly flawless motion detector that performs almost identically to a human observer.
Creating FreezeFrame Experimental Protocols#
Protocols#
Up to 20 different protocols can be set up in advance using the protocol window below. The onset and duration of any of the 8 different outputs, plus sounds. are specified by clicking-and-dragging on the graph or typing into the text entry box below. Each stimulus can be turned on repeatedly during a trial.
Here, stimuli 2 through 8 are activated in sequence, twice. A shock (stimulus 1) is delivered coincident with onset of stimulus 4. In addition, during each sequence of stimuli, a sound is played, during the first seqeuence, sound 1, and during the second sequence, sound 2.
Sounds#
Up to 10 different sounds can be configured in FreezeFrame. Different sound types include:
- Pure tones
- White noise (hiss)
- Frequency sweeps.
For tones, frequency and amplitude are selectable, and the tones can be made to pulse with any frequency and duty cycle. White noise can also be programmed to pulse. For frequency sweeps, start and end frequencies, duration, and repeat rate are selectable. For all three sound types, the amplitude at the start and end can tapered using the Rise Time control, to avoid the audible click that occurs when sounds start and stop abruptly.
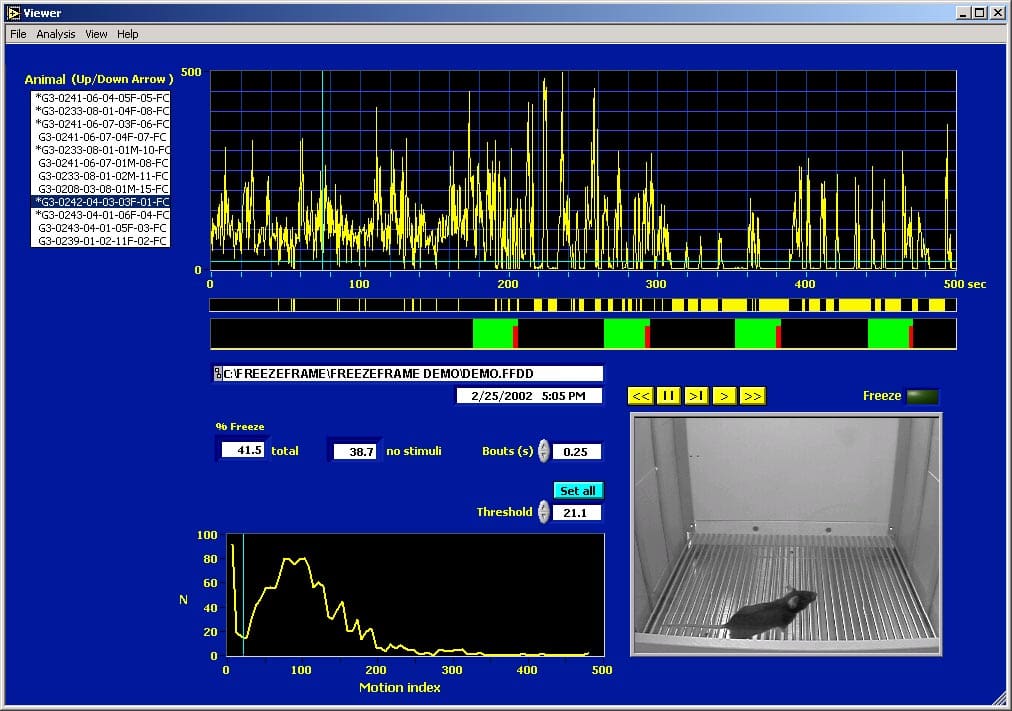
The FreezeFrame Trial Viewer#
The different animals stored in the data file can be selected from the listbox to the left. The video of the trial is played using the yellow player buttons. QuickTime movies can be exported from the trial video images. The top graph shows the time-course of the motion index calculated from the video frames. Values below 20 (see histogram at lower left) indicate freezing. The yellow bar graph shows when freezing occurred. The red-green bar graph shows the stimulus protocol that was used during this trial. Green = sound; red = shock. Various data and video export functions are accessed from the menus.
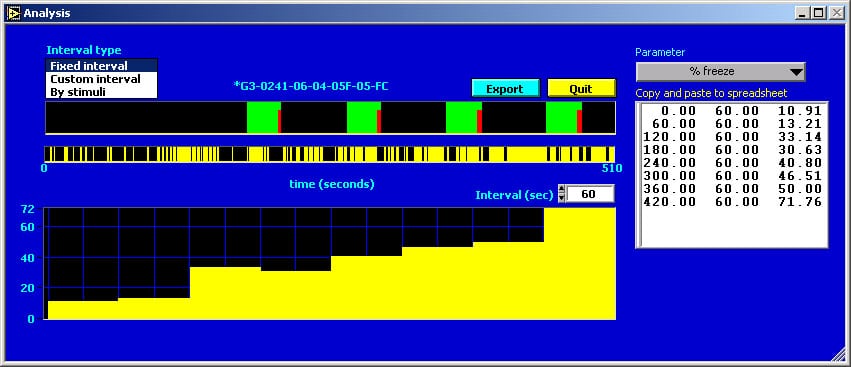
Batch Export from the FreezeView program#
This picture shows the interval analysis export window. The stimulus and freeze graphs for the selected trial are redrawn from the main window. The interval graph shows the percent freezing for fixed intervals, in this case 1 minute long. The export button writes the values for the selected analysis for each interval and for each animal directly to an open Excel spreadsheet. Analyses include % freezing, number of bouts of freezing (of specified minimum length), mean bout duration and mean interbout interval. Custom intervals of variable length can also be specified.
Ordering FreezeFrame#
Software
- FreezeFrame with data collection and analysis components runs on laptop or desktop computers with Windows 7/8/10
Hardware (Available from Actimetrics)
- 1 to 4 USB cameras with zoom lenses
- 1 to 4 Cages (Isolation Chambers optional)
- USB Interface for stimulus control
- Shocker(s)
- Audio Amplifier (4 channel)
- Cue and House Lights
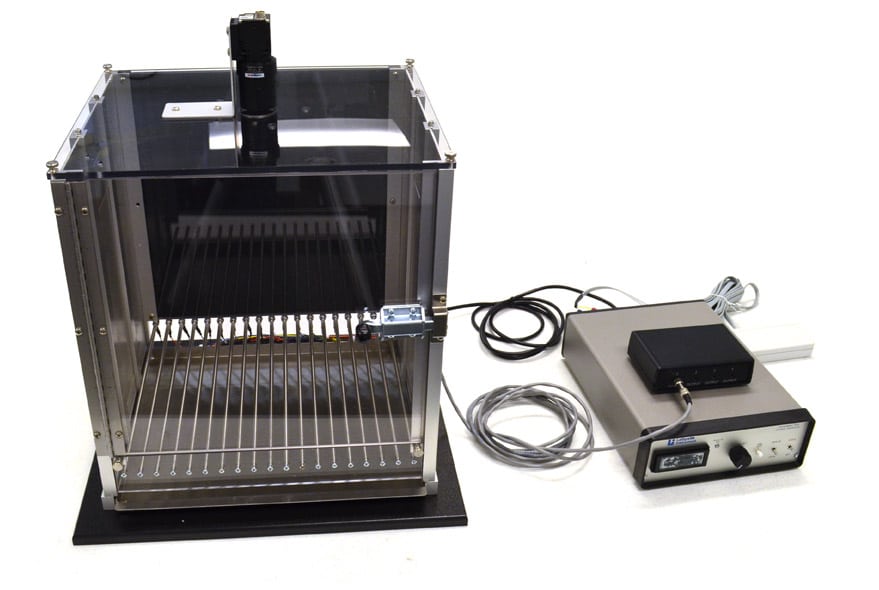
Shock Cage with camera mounted on the top. Shocker and 4-channel audio amplifier at right.
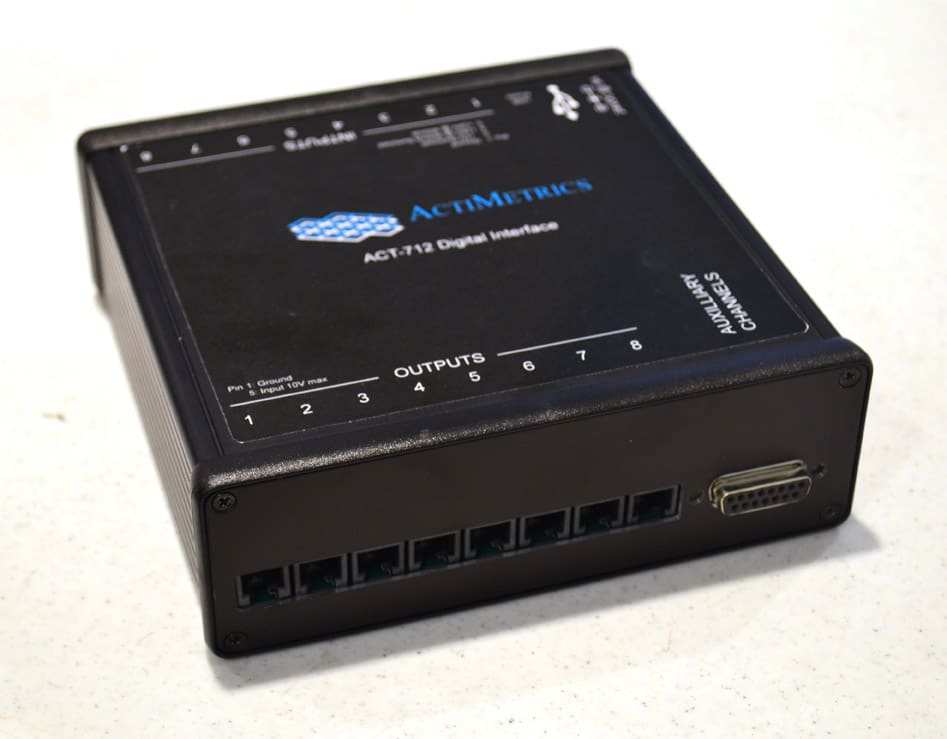
USB Interface for Stimulus Control. The interface can control up to 8 outputs. Each output can supply 24V at up to 400 mA, or 5V at 10 mA (TTL-compatible).
Cue Light. Connects directly to the stimulus interface above.